You can take thread dumps in a number of ways. Jstack, Kill -3, CTRL + Break, JvisualVM, Jmc, Jcmd, ThreadMXBean any tool can be used to generate thread dump. Here, we will discuss all of these in detail.
A thread dump is a snapshot representing states of all threads that are part of the JVM process. A stack trace represents the state of a thread, which includes the journey and details of that thread.
Thread dump includes your application threads as well as JVM internal threads. So don’t be surprised if you can’t recognize some threads. Thread dump provides the great insights to thread activities, which can help us to analyze problems and optimize the application performance.
For few techniques to generate thread dumps, you will require to supply Java process id (PID). So lets see first, how you can get process id.
Getting PID
You can use different ways to get PID of your Java process.
- In Linux you can use “ps -el | grep Java” command to get java process ids.
- In Windows, from task manager, you can find the Java process ids.
- In JDK, you can find the inbuilt command “jps” under JAVA_HOME/bin to list all java process ids. Use this command
Jps -VNow, lets discuss the different ways to take Thread Dumps.
1. JSTACK
“jstack” is effective command tool to get thread dump. You can find this tool in JAVA_HOME/bin folder, its available in JDK 5+ versions. Following is the command
jstack -F <PID>Example
jstack -F 54321Saving the thread dump into a file
jstack -F 54321 > thread-dump.txt2. KILL -3
Due to security reasons, mostly on production environment machines, only JRE is installed. Therefore JDK’s various utilities are not available. But at operating system level, there are other commands available to do this job.
To perform a thread dump in Linux: Identify the process ID of running Java processes with ps command as explained earlier. Use this process ID to generate the thread dump.
Note: This command will not terminate the JVM process.
kill -3 145603. Windows (CTRL + Break)
This option is available in Windows operating system only. To perform a thread dump in Windows: Go to start_noapp_console command prompt window and press Ctrl + Break to generate the thread dump.
4. JvisualVM
Java VisualVM combines several monitoring, troubleshooting, and profiling utilities into a single tool. For example, most of the functionality offered by the standalone tools jmap, jinfo, jstat, and jstack were integrated into Java VisualVM. Other functionality, such as some that offered by the jconsole command, can be added as optional plug-ins.
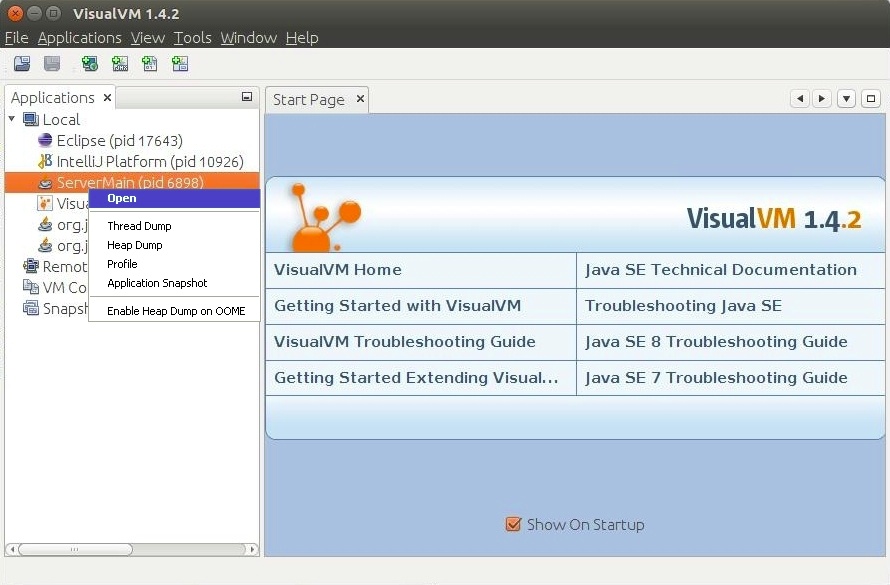
You can use Java VisualVM to take a thread dump to capture information about the active application threads at the time you take the thread dump. When you take a thread dump, the thread dump opens in a sub-tab of the application in the main window. A node for the thread dump appears under the application node in the Applications window. You can take a thread dump in the following ways:
- Right-click the application node in the Applications window and choose Thread Dump.
- Click the Thread Dump button in the Threads tab of the application tab.
5. JMC
Java Mission Control (JMC) is a Profiling, Monitoring, and Diagnostics Tools Suite. Java Mission Control is a tool for production time profiling and diagnostics for the HotSpot JVM. The two main features of Java Mission Control are the Management Console and Java Flight Recorder, but several more features are offered as plug-ins, which can be downloaded from the tool.
JMC tool is present in JDK_HOME\bin\jmc, Once you launch the tool, you will see all the Java processes that are running on your local host. JMC uses JVM’s Flight Recorder option to generate thread dumps, which means on your JVM flight recorder option should be enabled with following jvm arguments:
-XX:+UnlockCommercialFeatures -XX:FlightRecorder.Prior to JDK 8u40 release, the JVM must also have been started with these flags. Since the JDK 8u40 release, the Java Flight Recorder can be enabled during runtime.
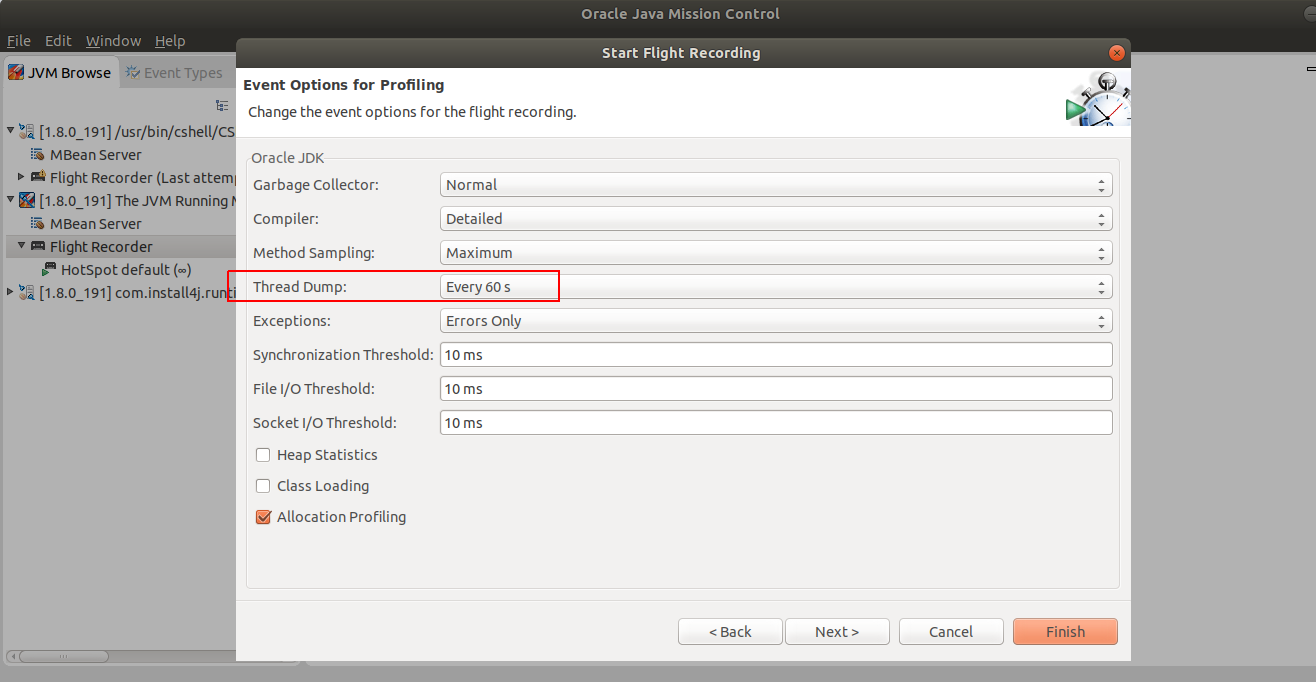
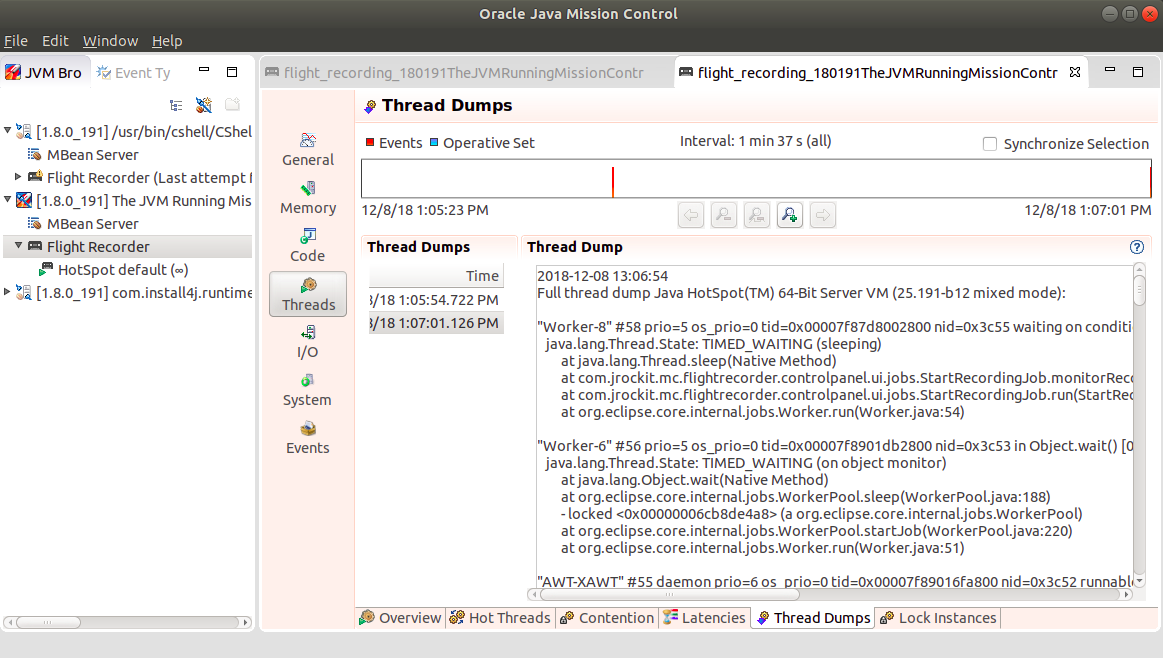
As shown in above image, you can choose the different interval time for generating thread dump. Once thread dumps are generated, you can navigate to thread dump pan, to view the generated list of thread dumps.
6. JCMD
The jcmd utility comes with the JDK and is present inside the JAVA_HOME/bin. It is used to send diagnostic command requests to the JVM, where these requests are useful for controlling Java Flight Recordings, troubleshoot, and diagnose JVM and Java Applications. It must be used on the same machine where the JVM is running, and have the same effective user and group identifiers that were used to launch the JVM.
This utility can help us in getting many details about the JVM process. To print all threads with stack traces using Thread.Print
jcmd <process id/main class> Thread.printExample: Classes taking the most memory are listed at the top, and classes are listed in a descending order.
jcmd 8845 Thread.print > ~/threadDumps.txt7. ThreadMXBean
ThreadMXBean is an interface and belongs to java.lang.Management package. It helps to detect the threads which have entered into deadlock condition and also helps in retrieving details about them. ThreadMXBean is an interface, to get an instance of ThreadMXBean use getThreadMXBean() method of ManagementFactory.
public class Main {
    public static void main(String[] args) {
        ThreadInfo[] threadInfos = ManagementFactory.getThreadMXBean()
            .dumpAllThreads(true, true);
        Arrays.stream(threadInfos).forEach(System.out::println);
    }
}


Pingback: How to learn java